You’ve entered your birth details and generated your chart. Now you’re looking at coloured shapes, connecting lines and two columns of numbers. Where do you begin?
You don’t need to understand the whole chart at once. This guide explains what you’re looking at, how the parts connect and shows you which results to read first, so you can apply it to your own chart.
What Is a Human Design Chart?
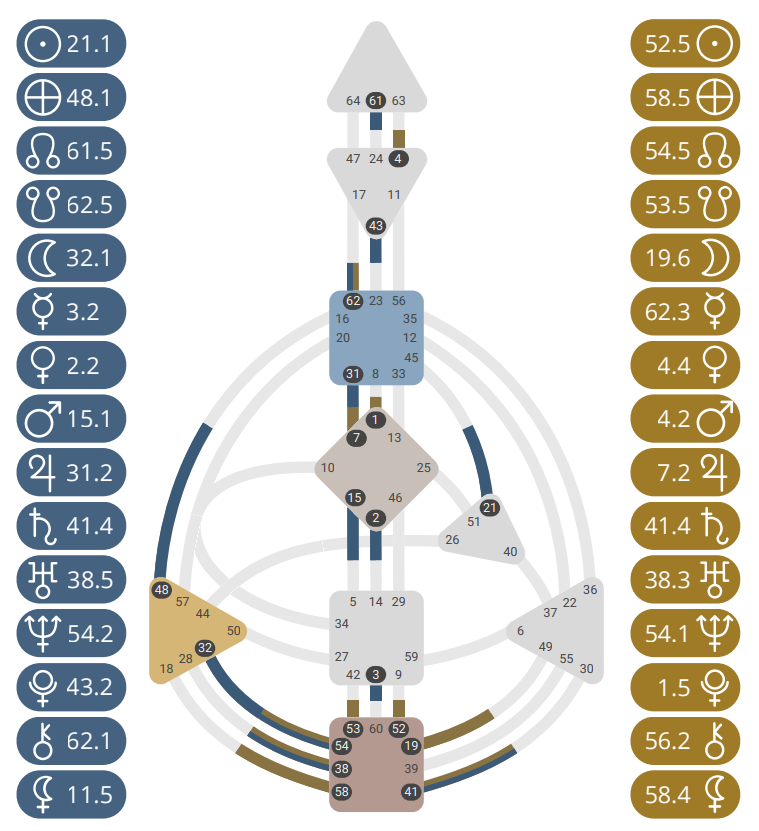
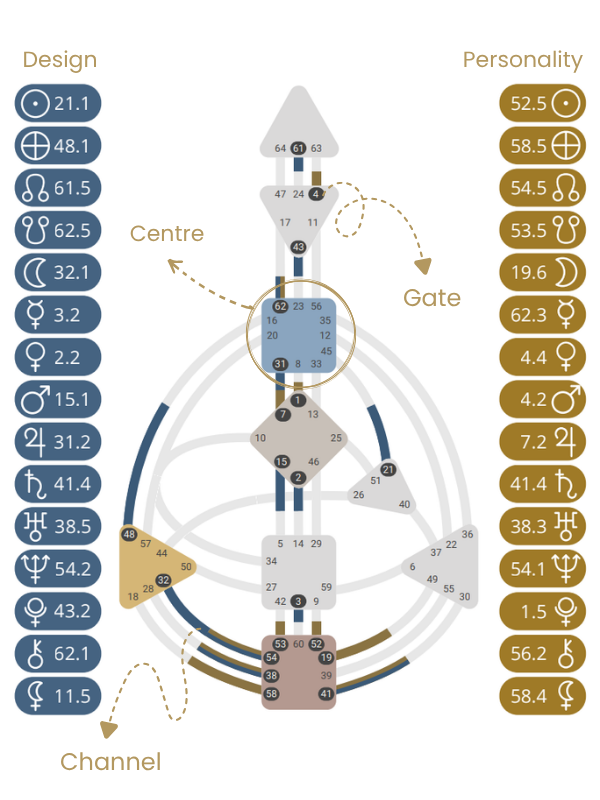
A Human Design chart is calculated from your birth date, time and place. Its body-shaped diagram, called a BodyGraph, contains nine coloured or white shapes, numbers and connecting lines.
Each part has a meaning in Human Design. Some parts describe how you make decisions. Others explore how you communicate and relate to others. Reading them together helps you understand what your chart means.
Most chart calculators show two sections:
- Your BodyGraph: the diagram with shapes, numbers and connecting lines.
- Your results: a list showing your Type, Strategy, Authority, Profile and Definition.
Not sure where to look first? Start with your chart summary. Find your Type, Strategy and Authority, then read what each means. These give you a starting point for understanding the rest of your chart.
New to Human Design? Read What Is Human Design? A Simple Guide for an introduction.
How does entering your birth details produce a chart full of shapes and numbers?
The calculator checks planetary positions at two points in time:
- The moment you were born.
- An earlier point, roughly three months before your birth.
The earlier point is calculated using the Sun’s position, rather than counting back a fixed number of days.
The calculator marks numbered points, called Gates, as activated. When both Gates at either end of a connection are activated, they form a defined Channel. This colours the Channel and the Centres it connects.
You don’t need to calculate or draw any of this yourself. Enter your birth date, time and place to see your chart, along with a summary showing your Type, Strategy and Authority.
Not sure of your exact birth time? Check your birth records or ask a family member. You can still get started with an approximate time, but some details may change if you find a more accurate time later.
What do the shapes mean?
The nine shapes in the BodyGraph are called Centres. Each has a different subject within Human Design.
| Centre | Main Subjects |
|---|---|
| Head | Inspiration, questions and mental pressure |
| Ajna | Thinking, analysing and forming opinions |
| Throat | Communication and expression through words or action |
| G | Identity, love and direction |
| Heart / Ego / Will | Willpower, commitments, money and resources |
| Sacral | Gut responses and the capacity to sustain activity |
| Solar Plexus | Emotions and emotional awareness |
| Spleen | Instinct and awareness of what feels safe or healthy |
| Root | Stress, drive and pressure to act |
Why are some centres coloured and others white?
Look at the nine shapes in your chart. Their colour tells you whether each Centre is defined or undefined.
- Coloured Centres are defined. Human Design describes their functions as more consistent. For example, a defined Throat is associated with a more consistent way of expressing yourself.
- White Centres are undefined. They are described as more open to influence from people around you.
- A white Centre with no activated Gates is completely open.
A white Centre can still contain activated Gates, because a Gate alone doesn’t colour in the shape. The Centre only becomes coloured when a complete Channel connects it to another Centre.
What do the numbers inside the centres mean?
The numbered points are called Gates. There are 64 Gates, each linked to a theme from the I Ching.
For example:
- Gate 1: creativity and self-expression.
- Gate 48: depth and finding practical solutions.
- Gate 54: ambition and the drive to get ahead.
Not every number is an activated Gate. Many charts display all 64 numbers, then highlight those activated by your birth calculations. The highlighted Gates show which themes form part of your chart interpretation.
For example, if Gate 48 is highlighted, you would read about its theme of depth and practical solutions, then explore how it connects with the other details in your chart.
What do the connecting lines mean?
Some lines in your chart are fully coloured, while others stop halfway. What makes the difference?
The connections between Centres are called Channels. Each links two specific Gates, one at either end.
- One Gate activated: Half the connection is coloured.
- Both Gates activated: The Channel and its two Centres are coloured and defined.
For example, Channel 7–31 connects Gate 7 in the G Centre with Gate 31 in the Throat. If only Gate 7 is activated, the Channel is incomplete. If both are activated, the complete Channel has its own theme: Leadership through guiding and influencing others.
A complete Channel adds meaning beyond either Gate alone. That’s why reading your Gates and Channels together gives you a fuller understanding of your chart.
What do the activation colours mean?
Many Human Design charts use black and red. Our example uses gold for Personality and navy for Design. The colours differ, but the meaning stays the same.
| Marking | What It Means |
|---|---|
| Personality (gold here, usually black) | Calculated at birth. Associated with qualities you may recognise more easily in yourself. |
| Design (navy here, usually red) | Calculated roughly three months before birth. Associated with qualities others may notice before you do. |
| Both colours together | Both calculations contribute to that Gate or Channel. |
You might read about a Personality activation and think, “That sounds like me.” A Design activation may describe something you don’t readily notice, but people close to you recognise.
A complete Channel can use either colour or a mixture of both. What matters is that both Gates are activated. A Centre’s fill colour shows that it is defined, not whether it comes from Personality or Design.
Read more about Personality and Design at Jovian Archive.
What do the columns beside the BodyGraph show?
See a number like 48.1 beside a planetary symbol and wonder what it means? Read it in two parts:
- 48 is the Gate: The main theme.
- 1 is the Line: A more specific expression of that theme.
Each Gate has six Lines. 48.1 and 48.2 share Gate 48’s theme of depth, but describe different expressions. The columns list activated Gates and Lines, with symbols showing the planet or chart point behind each entry.
Where do Type, Authority and Profile fit in?
You may have found your Type and wondered, “Is that all I need to know?” It’s a starting point, but the other details help explain why people with the same Type can be different.
Look for the chart summary beside or below the BodyGraph.
| Result | What to Look For |
|---|---|
| Type | Your broad category: Generator, Manifesting Generator, Manifestor, Projector or Reflector |
| Strategy | How your Type is guided to approach opportunities |
| Authority | How your chart suggests you approach decisions |
| Profile | How you learn, approach life and relate to others |
| Definition | How your coloured Centres connect |
What Does a Profile Like 5/1 Mean?
The two numbers describe a combination of Profile Lines. Their themes include research, natural talent, trial and error, relationships, practical problem-solving and leading by example.
Although Gate activations also use Line numbers, a Profile of 5/1 does not mean Gate 5, Line 1. The slash identifies a Profile, while the dot in a number such as 48.1 separates a Gate from its Line.
What Does Definition Mean?
Look at your coloured Centres and follow the complete coloured Channels between them. Do they all connect in one group, or form separate groups? This arrangement is called your Definition.
- Single Definition: One connected group.
- Split Definition: Two separate groups.
- Triple Split Definition: Three separate groups.
- Quadruple Split Definition: Four separate groups.
- No Definition: No defined Centres, as in a Reflector’s chart.
These details work together. Two people may share a Type but have different Authorities and Profiles, so the same description won’t explain both charts fully.
How do you start reading your chart?
Start with the written summary, then use the diagram to find the details it describes.
- Check your birth details. Make sure the date, time and birthplace were entered correctly.
- Find your Type, Strategy and Authority. Read what they mean together.
- Locate your Centres. Notice which are defined, undefined or completely open.
- Look at your complete Channels. Check that both Gates are activated.
- Explore your Profile and Gates gradually. There’s no need to work through every number in one sitting.
As you read, think of situations from your own life. Does the description match something you’ve noticed about yourself? You can keep exploring without needing every detail to make sense immediately.
Want help understanding your results?
You can now identify the Centres, Gates and Channels and understand the basic meaning of each one. But what do they mean in your chart, and how do they fit together?
Our personalised PDF reports explain different parts of your chart in clear, beginner-friendly language. See what’s included and preview example pages to help you choose the report that suits you.
Don’t have your chart yet? Get your free chart here.